The Nickel Plate Trail: Facts Versus Fictions

Last year, the City of Fishers approved a tax increase for the Nickel Plate Trail construction. This tax was expected to raise somewhere between $7 and $9 million dollars that can be used toward constructing the trial. Additionally, the City of Fishers released a master plan for the trail that showed numerous amenities that could be included with the trail. With the tax in place and being collected and a “plan” having been created, where do things stand? What are the facts on the trail today?

Before digging deeper into where things stand today, it is important to make a few clarifications.

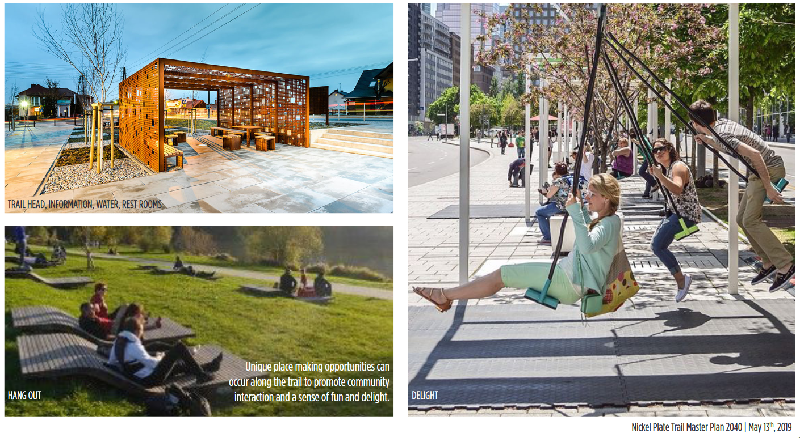
First, if you review the master plan, you will note that it indicates that it is a twenty-one-year plan. This time window is not always clearly stated in meetings nor when the trail amenities are discussed. If you look at the plan and see art, LED screens, sitting areas, fountains, gardens, and other features, you should understand that these could take up to 21 years to provide. The master plan unfortunately is void of any breakdown of dates or costs for the specific items that are illustrated.

What should also be clarified is what is meant by the Nickel Plate Trail. In this case, the Nickel Plate Trail is the new trail that is expected to be built where the Nickel Plate railroad tracks previously existed. This is not the Nickel Plate Trail currently found in Cheeney Creek in Fishers. It also is not the trail identified as the Nickel Plate Trail in the 2040 plan released by the City in 2016. My understanding is that the Nickel Plate Trail identified in the 2040 city plan is now being called the Conner Trail.

Where Do Things Stand Today?

Today, the process of building the trail has started. Most of the rails have been removed and a rocky dirt path stands where they had been located. This city had taken bids for the removal. They chose the one company that agreed to pay to do the removal work in exchange for keeping the removed materials. The company did, however, include a waver that they would not remove the rails at the intersections because of the added cost of making repairs to roads and such.

The Nickel Plate Trail Today (131st Street)

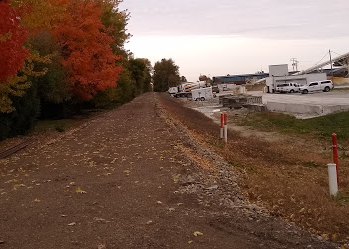
The removal work has been done. What is worth noting is that a city board member indicated that the hundreds of thousands that the city will receive from this are not going to build the trail. Rather those funds are being given away as a donation.

To sum up where things stand today, taxes are being collected, fees are being received, and the rails are removed.

Funding the Next Step

It is important to note that the tax increase done by the city of Fishers was an increase to the property tax rate. This means that it doesn’t just get collected the first year, but it gets collected until the City removes it. The $7 to $9 million gets collected this year, next year, the following year, and so on until the city reduces the tax rate. Of course, there is nothing that I am aware of that requires the city to use the increase for the trail beyond the first year, so there is no reason to expect it will ever go away. 

One of the things the city did this past year to try to reduce cost of the trail was to apply for grants. Unfortunately, Fishers did not get the grants that they targeted. My understanding is that those funds ended up going to other places such as Indianapolis projects. The city is planning to continue to apply for additional grants. I was told that there is a plan to solicit the state for a grant to help with the trail that would be on a much larger scale and could include Noblesville and Indianapolis. Should such grants be received, that would reduce the local tax cost for residents or possibly speed up the delivering of some of the amenities.

Back in February, the Indianapolis Star reported that the initial funds from the tax increase would be used to build the first phase of the trail including amenities such as bathrooms, water fountains, landscaping and art. This first phase is expected to be the section of trail from 106th Street to 126th Street and would include an underpass on 116th Street. There were two other phases that have now been combined, which would be the trail sections from 96th Street to 106th Street and from 126th Street to 146th Street.

What’s Next for the Nickel Plate Trail Plan?

With a new tax increase in place, the funds should be ready to start constructing the trail. Being that it is now Fall, a city official indicated to me that construction will likely not start until the Spring.

The city put out RFPs for the first phase of construction and was working with three companies. The result is that they now have a cost projection for phase one to be approximately $5.5 million and phase 2 to be $2 million.  

This is higher than the initial rough cost estimates presented a couple of years ago of just over $4.2 million for the entire Fishers segment. The good news is that this totals within expected range for the first year of new tax dollars and gives funds for both phases of the trail. That should cover the basic trail clear across the city of Fishers.

I was told that part of what kept the first phase number lower ($5.5 versus $7 to $9 million) is the expected cost of the underpass at 116th Street. The city council member indicated that per the proposals received, this construction is expected to cost under $3 million. 

But…

When the numbers come in lower than expected for a city project, you must start asking questions. Often there is a “but” that needs to be explored.

In this case, I’ve been told that what is being built is just the trail. No amenities, no connections to existing trails, and no other features beyond the asphalt trail and the underpass at 116th Street. All the sizzle or bells and whistles are future items to be addressed at additional costs.

For those living down the road from the future trail on 106th or 131st Street, there will not be new connecting sidewalks that get you to the trail. That is future stuff.

Some of the trail amenities shown in the NPT Plan

So Much Promised, so Little Planned….

The NPT plan promises a lot of amenities. Expectations are high on what the trail features are going to include. The only items that have been truly planned, however, is the basic asphalt trail. While amenities have been listed and while there is a list of ideas wanted (and called a plan), there are not priorities set, there is no order set, and there are no timelines set. More importantly, even though they’ve been identified, there are no cost estimates associated with the amenities and tasks to help create a working plan.

Having said that, by the time the asphalt is laid for the initial two phases, the city should be on their second or third year of collecting the new taxes. If the money remains allocated for the trial, then there should be plenty of money to add connections to the trail and start building amenities. In fact, if the tax is never rolled off and the plan truly takes 21 years to build, then (ignoring increased assessed values and new homes) the city should have working capital of between $147 and $189 million to put against the trail. That should be enough to provide a lot of sizzle to the trail.

In Conclusion…

The trail has started and the rails are mostly gone. People are walking the existing path, which should turn to asphalt next year. It is great that the city is looking for grants and other means to offset the cost. The city has, however, also increased our taxes to build this trail. It is important that we, the residents, hold the city accountable for spending the increased in the manner they promised, and that we require the city to eliminate the tax increase when the funds are no longer being use for the trail as promised.

# # #

Do you know how many parks are already in Fishers? Do you know what amenities already exist? We have some fantastic parks! Order a copy of my book from Amazon and not only will see the variety of parks, but you can have fun doing the “Find the difference” puzzles! Purchasing a copy helps offset my blogging costs and supports a small, local publisher!

Buy a copy: Amazon

Discipline By The State Numbers: HSE Schools

It’s always interesting to stumble upon new data related to our local schools. I was shown data on “school environments.” More specifically, I reviewed data summarizing disciplinary actions with schools and school districts. This data is available on the Indiana Department of Education (DOE) web site. On this site, you can find information on Indiana school districts and achievements, as well as on the data I mention here regarding school environments.

You can visit the site for the details. What drove me to this site was the promise of data on discipline. My understanding is that this is based on data reported to the state by the school districts. What also lead me to this site was a discussion on the disparity of discipline within schools in Indiana.

Of course, the starting point to look into this is knowing the diversity of HSE Schools. The DOE site presents the following data:


Clearly, HSE Schools are predominately White (72.6%) with most people being economically “stable” (84.3%).

Where then do disciplinary problems occur?

The following chart from the DOE site shows that there were 1,384 safety and disciplinary issues reported in 2017-18 for the HSE School district. This is the most recent data in the DOE system. This is broken out between suspensions and expulsions:


Not surprising, all of the HSE district numbers are lower than the state averages. The biggest area for HSE is for In School Suspensions. If you dig into the In School Suspensions data, you’ll quickly see that while Whites are in the majority of the student body, they are not the majority in the In School Suspensions. Rather, Black/African-American and Multiracial both have more disciplinary issues:


If you look at the Out of School Disciplinary numbers, then not only is it Black/African-American and Multiracial groups that have more disciplinary actions than Whites, but Hispanics also have more cases:

The specific details of these disciplinary actions are not a part of the data I found. While no conclusions can be drawn from this data along, it is easy to infer from the data that a substantially higher percentage of non-White students are likely to face disciplinary action than White students within the district.

The Out of School suspensions within IPS showed the ration of Black/African-American to White as 3 to 1, which is similar to HSE Schools. While this might seem to indicate a consistency, the ration of Black/African-Americans to Whites at IPS is 2 to 1 versus HSE’s 1 to 10. That disparity makes this a topic that should be looked into deeper.

A final note on numbers…

As mentioned, HSE had 1,384 issues reported. While this might seem like a lot, if you look at the entire state of Indiana, the number of issues reported was 223,611. Indianapolis Public Schools (IPS) had nearly 13,000 reported issues (12,891). During the same period, Carmel Clay Schools had only 624 disciplinary incidents, which is less than half of HSE’s number. Having said that, Carmel also had 24 school-related arrests and 6 referrals to law enforcement, whereas HSE had none. It is interesting to note that IPS also had no arrests or referrals to law enforcement during the reporting period.

It is always interesting to look at data and see what stories it tells. To look closer at this data, you an check out the DOE site at:
https://inview.doe.in.gov/corporations/1030050000/profile

# # #

What’s Happening in HSE Schools – Sept. 2019 SAC Meeting

For those that don’t know, within the Hamilton Southeastern Schools (HSE), the superintendent is Dr. Bourff. On a regular basis, Dr. Bourff meets with a group of people from across the district. This group is primarily composed of leaders from each of the school PTOs as well as a handful of additional parents provided by school board members.

Today, Dr. Bourff met with this group and provided some discussion on a number of things happening in the district. This posting is a summation of my notes from this meeting.

New Administrator

Dr. Bourff introduced Kim Lippe as the Executive Director of Student and Staff Services. Kim’s role replaces the position that was vacated by Mike Beresford and was being temporarily filled by Dr. Carnes. Per the HSE web site, she will be responsible for a variety of things:

  • Oversees Human Resource and Student Services Departments
  • Primary Director Overseeing Certified Staff
  • District Liaison to the Teacher’s Association Regarding Contract and other Personnel Issues.
  • Coordinates Hiring of Administrative and Certified Instructional Staff
  • District Supervisor of Matters Involving Student Behavior, Attendance, Discipline, and Due Process
  • District Supervisor of School Safety
  • Homeless Liaison for the District
  • District Supervisor of School Counseling Program
  • District Supervisor of Student Services
  • Corporation Liaison to School Attorney and other Legal Services

Social Emotional Learning (SEL)


If you are not familiar with the acronym SEL and the term Social Emotional Learning, you might want to research it a little bit if you have a student within HSE. This acronym is being used more and more.

The district has set up a web page on the district site at https://www.hseschools.org/counseling/social-emotional. This page has information on SEL including an embedded whitepaper with tons of information including an overview, stats, HSE milestones, and much more. I won’t rehash the material here, as you can find it all at the link included.

One of the ways SEL is happening within the district is through the #WeGotThis program. A video had been sent to all parents earlier this year promoting the We Got This concept.  I’ve included that video here:

What was shared in Dr. Bourff’s committee meeting were a few points related to SEL. First, meta studies have shown that there is a 11% increase in academic success in schools that have SEL programs. He also clarified that the mental health initiative within the district is different from SEL. Whereas mental health is considered a health-based concept, SEL is considered to a set of skills. Many of these skills are aimed at understanding and managing emotions, stress, and more.

It was shared that most employers consider SEL skills to be the hardest to find, ye the most importance for success. As such, the more the district can do to teach SEL skills, the better candidates our kids will be for future jobs.

The district plans to continue working to identify stressors in our schools and other elements that can be addressed to improve SEL. In addition to the #WeGotThis video that was distributed and the second video on the HSE site, there are currently plans to produce roughly seven more videos. The district is open to ideas for topics for these videos. An example of one topic that has come up is vaping.

In addition to the videos, the administration has been sending monthly tips to the staff and are looking to possibly do more around parent-teacher nights and other events.

iLearn

ilearn, like iStep, is almost considered a dirty word, but the more I hear about it, the less I feel that way. Dr. Combs present results from the iLearn tests at this meeting. They also presented the same information to the board earlier in the morning. Having attended both presentations, the information was the same; however, the advisory meeting in the afternoon produced many more questions.

One of the key things mentioned was about how iLearn is different from iStep. This is an important distinction. In short, the iLearn has been created to be much more application focused. Rather than being pure regurgitation of facts and figures, it tests in a more authentic learning style. Simply put, it tests to see if a student can apply what they learned versus simply testing to see what they learned.

In an application-based learning style you are asked to solve what are more real-life scenario questions. For example, a math question might ask, what is the distance between Bridgetown and Albany based on the following sign:

See the source image

This test is a simple subtraction problem. This would be a math problem where the student would need to take the 359 and subtract the 84 miles from Bridgetown. On the iStep test, this would have been a question asking the student what 359 – 84 is. While these both are asking the same question, the app-based requires the student to be able to not only know the answer to a math problem, but to be able to apply it in a more authentic manner of learning. In short, the iLearn doesn’t just test that the student memorized something, but rather tests to see if they can apply what they learned.

In addition to talking about the testing approach, data was shown for the results. This included showing many charts and graphs as to how the students faired.

With a new test, the expectation is that scores will go down. Dr. Combs stated that scores go down every time there is a new test, but then slowly pick up. Dr. Combs also commented on the number of kids that failed. HSE Schools performed above the state average in both the math and languages areas of the tests. Even so, there was a dip in the number of kids that passed. The standardize tests are create with an expectation that a certain number of kids will fail. There is an expected “cut rate”

One of the other changes with the iLearn is that the test is more adaptive or responsive. As a child takes the test, if they get an answer correct, then they will be given a harder question. If they get an answer wrong, the next question given should be easier. In addition to this responsive nature, the testis was also changed to remove the time element. Kids are given the they need to complete the test.

It was also noted that the tenth-grade class did not switch to iLearn this past year, but still used iStep. Their scores were also presented. This year the tenth-grade testing is expected to be skipped, but the current class will take the test in their Junior year. This will be a “yet to be named” test, but could be a version of the S.A.T. or another test.

Other Testing

Dr. Bourff mentioned that the state is looking into other measurements beyond just the iLearn test that can be used to assess kid. This includes looking into different measurements from traditional test scores. This is one of the reasons the district used Panorama.

The Panorama testing has been discussed at school board meeting in association to administrative goals. I wrote an article recently on ‘Striving for average’ that is related to this testing. You can find the results of the Panorama survey on the HSE site on the analytics page at https://www.hseschools.org/about/analytics. There are both the Family-School Relationships Survey results and the Panorama Student Survey Report.

Flipped Schedules

Flipped schedules and the potential of HSE Schools flipping the start time has been a topic at school board meetings and on social media for a while now. Dr. Bourff mentioned that the administration is research this and is planning to have a recommendation for the HSE School Board by the end of the calendar year. If the recommendation requires action, then it is hoped the board will make a decision in January of 2020 for action possibly next fall for the 2020-21 school year.

Dr. Bourff mentioned that there is a lot of reasons for flipping as well as counter arguments. One of the big reasons for flipping would be the mental well-being of kids. Specifically, younger kids learn better earlier in the day and tend to be finished (wiped) by 2:00 or 2:30. Our younger kids currently go well past this time. It is thought that older kids do better later in the day than the younger kids.

It was note that Noblesville has flipped their start times as have other schools. Dr. Bourff is talking with the other districts. He has also talked with students at the high schools and plans to have additional discussions with not only kids, but also other groups.

The discussions regarding flipping include looking at a few other things as well. HSE has some of the longest school days with our older kids going roughly 50 minutes more than the required daily minimum. It was stated that because HSE has high performing schools, there is an expectation of longer class days. The elementary kids go roughly 75 minutes more than the required daily minimum. Some changes at the state level have opened a window to where these times could possibly be reduced a little bit. In the past, I’ve heard mention of possibly cutting 20 minutes from the elementary schools; however, that is not yet determined. Dr. Bourff was asked about the 20 minutes in the meeting.

In addition to possible time adjustments, there is also consideration of changing the transportation model. It was noted that there are not enough busses or drivers to do all the schools at the same time, so there will still need to be staggered start times in the district.

One question raised asked about the impact of start times on testing results. Dr. Bourff commented that history has shown that the change in start times has very little impact on testing results. The change in start times, therefore, focus more at improving the kids’ mental well-being.

In the advisory meeting, feedback was given that echoes what has been seen online and in other locations regarding flipping start times. This includes the issues of childcare and the impact on sports. A key point of feedback point given to Dr. Bourff was in regard to his gathering to feedback from a variety of sources on this topic. If the administration is going to push for a decision based on data that says flipping is best for the well-being of the kids, then he might want to forego getting feedback. The reasoning being, if all the feedback says, “don’t do it,” then it will look really bad to do the switch anyway.  Dr. Bourff indicated that he wants to collect the feedback, and that the decision will not be solely based on the data but will consider those all of those that are impacted as well.

In Conclusion

This is a summary, (my summary and a long one), of the core topics covered. Last year I was president of the Riverside Junior High PTO and shared this at the PTO meetings. Being that PTO leaders are a part of this meeting, you should ask them to share their perspective on the Superintendent Advisory Council meetings at your upcoming PTO meetings. These happen quarterly, so they won’t have an update every time!

While I have your attention, check out my latest book, which is available on Amazon.com. It’s a fun, “find the difference in the pictures” book where you also learn a tidbit about the public parks in Fishers:

Spot the Difference in Fishers, Indiana: City Parks Edition

# # #

One Reason SROs are Important

The other day I listened to a school safety webinar. A lot of familiar information was covered, but one tidbit of information stood out, which I’m sharing here.

If you don’t follow my blog or School/Kids focused Facebook page, then let me state that SRO stands for School Resource Officers (SROs). While the webinar was ultimately trying to sell software to help with school safety, my takeaway was further confirmation that the use of SROs within schools is important. While there are many reasons for this (look at some of my old articles), the webinar pointed out one big reason which is summarized in the following picture:

If there is an incident at a school, such as a school shooting, then how fast can a police officer get to the school? When you weigh this against the data point that with a standard weapon, one shot can be fired every 4 to 15 seconds, you quickly realize that minutes matter – a single minute matters.

It was stated that it can take 4 to 9 minutes to make a call for help. In that time, you could have over 15 casualties. If an officer can respond in 3 minutes, then that could be an additional 12 casualties. If the officer that shows up is a marathon runner, then they might be able to get from their car and into the building in a single minute. That minute could be another 4. That puts the total at over 30 with the assumption of a shot every 15 seconds rather than 4 seconds.

In the webinar, it was indicated that the response time of police to aggravated assault ranges are generally five minutes or more. Only 21 percent of responses by police happen within 5 minutes. 33 percent are within 6 to 10 minutes and 36 percent are from 11 to 60 minutes. Roughly 10 percent are of an unknown length of time. At a five minute response time, that’s between 20 and 75 shots with standard weapons.

Having SROs in place would eliminate the response time from the equation as well as the need to do an initial all, which are the longest delays in the equation. That means lives potentially saved. That seems like one big reason to have them.

Of course, this value is only seen when there is security breach at a school. The impact on SROs goes way beyond just being available for emergencies, but that’s a different article!

# # #

Safety in Fishers: A Failure to Learn From…

Larry Lannon reported on the nice crowd that attended the safety day at Fishers yesterday that occurred on the Eastern side of town. For anyone on the West side of Fishers on September 7th between 6:00 and 11:00pm, you have to wonder if safety had been considered.

With 11,000+ people merging into a two lane road with near non-existent traffic control, safety seemed to be lost. Fortunately, it didn’t seem that anything went wrong.

But what if something had happened?

Cars within the last couple of miles were reporting speeds of roughly an hour per mile to get into Conner Prairie. With cars being bumper-to-bumper, blocking intersections, and turning right from the left lanes it is easy to say that traffic was likely the worst Fishers has ever seen. Having gotten caught in the traffic, plus having lived across from Conner Prairie for over two decades, I can say it was the worst traffic I had ever seen for them.

What if a firetruck or rescue truck had needed to get to one of the houses across from Conner Prairie in several of the divisions whose only access is from Allisonville Road? What if a firetruck had needed to get to Conner Prairie. Could it have?

Last night’s event at Conner Prairie should be an eye opener for Fishers police, fire, and political parties as far as insuring the safety of Fishers residents and guests that come to our town. There are no plans in the Fishers 2040 plan to change the road in front of Conner Prairie from two lanes to four. There are no other major access roads other than going through an older neighborhood that is always blocked with parked cars to where a single car can barely get through, let along traffic going two directions or a fire engine.

While the neighborhoods around Conner Prairie deserve an apology, I believe the more important thing is that the city needs to make sure that if future crowds are going to converge on Conner Prairie – or any other location in Fishers – that it is done in a manner that allows for the safety of the residents to be kept at top priority. This includes making sure emergency vehicles have a way to get to any of the locations in or around the park.

On a related note…..

On a related note, there has been a trend for Fishers Police to shut down North bound Allisonville Road at 131st Street when they are letting out the traffic at Conner Prairie. For those people living off of Allisonville Road and south of 141st Street, this means you are redirected away from your home. This isn’t for an accident, but rather to make it easier to let the people at Conner Prairie leave at the expense of making it harder for residents of Fishers to get home.

Why?

Why is Conner Prairie get favoritism over tax paying residents of the city?

The irony of course, is that this traffic control happens after a concert; it doesn’t happen before when it is really needed more.

# # #