It’s always interesting to stumble upon new data related to our local schools. I was shown data on “school environments.” More specifically, I reviewed data summarizing disciplinary actions with schools and school districts. This data is available on the Indiana Department of Education (DOE) web site. On this site, you can find information on Indiana school districts and achievements, as well as on the data I mention here regarding school environments.
You can visit the site for the details. What drove me to this site was the promise of data on discipline. My understanding is that this is based on data reported to the state by the school districts. What also lead me to this site was a discussion on the disparity of discipline within schools in Indiana.
Of course, the starting point to look into this is knowing the diversity of HSE Schools. The DOE site presents the following data:
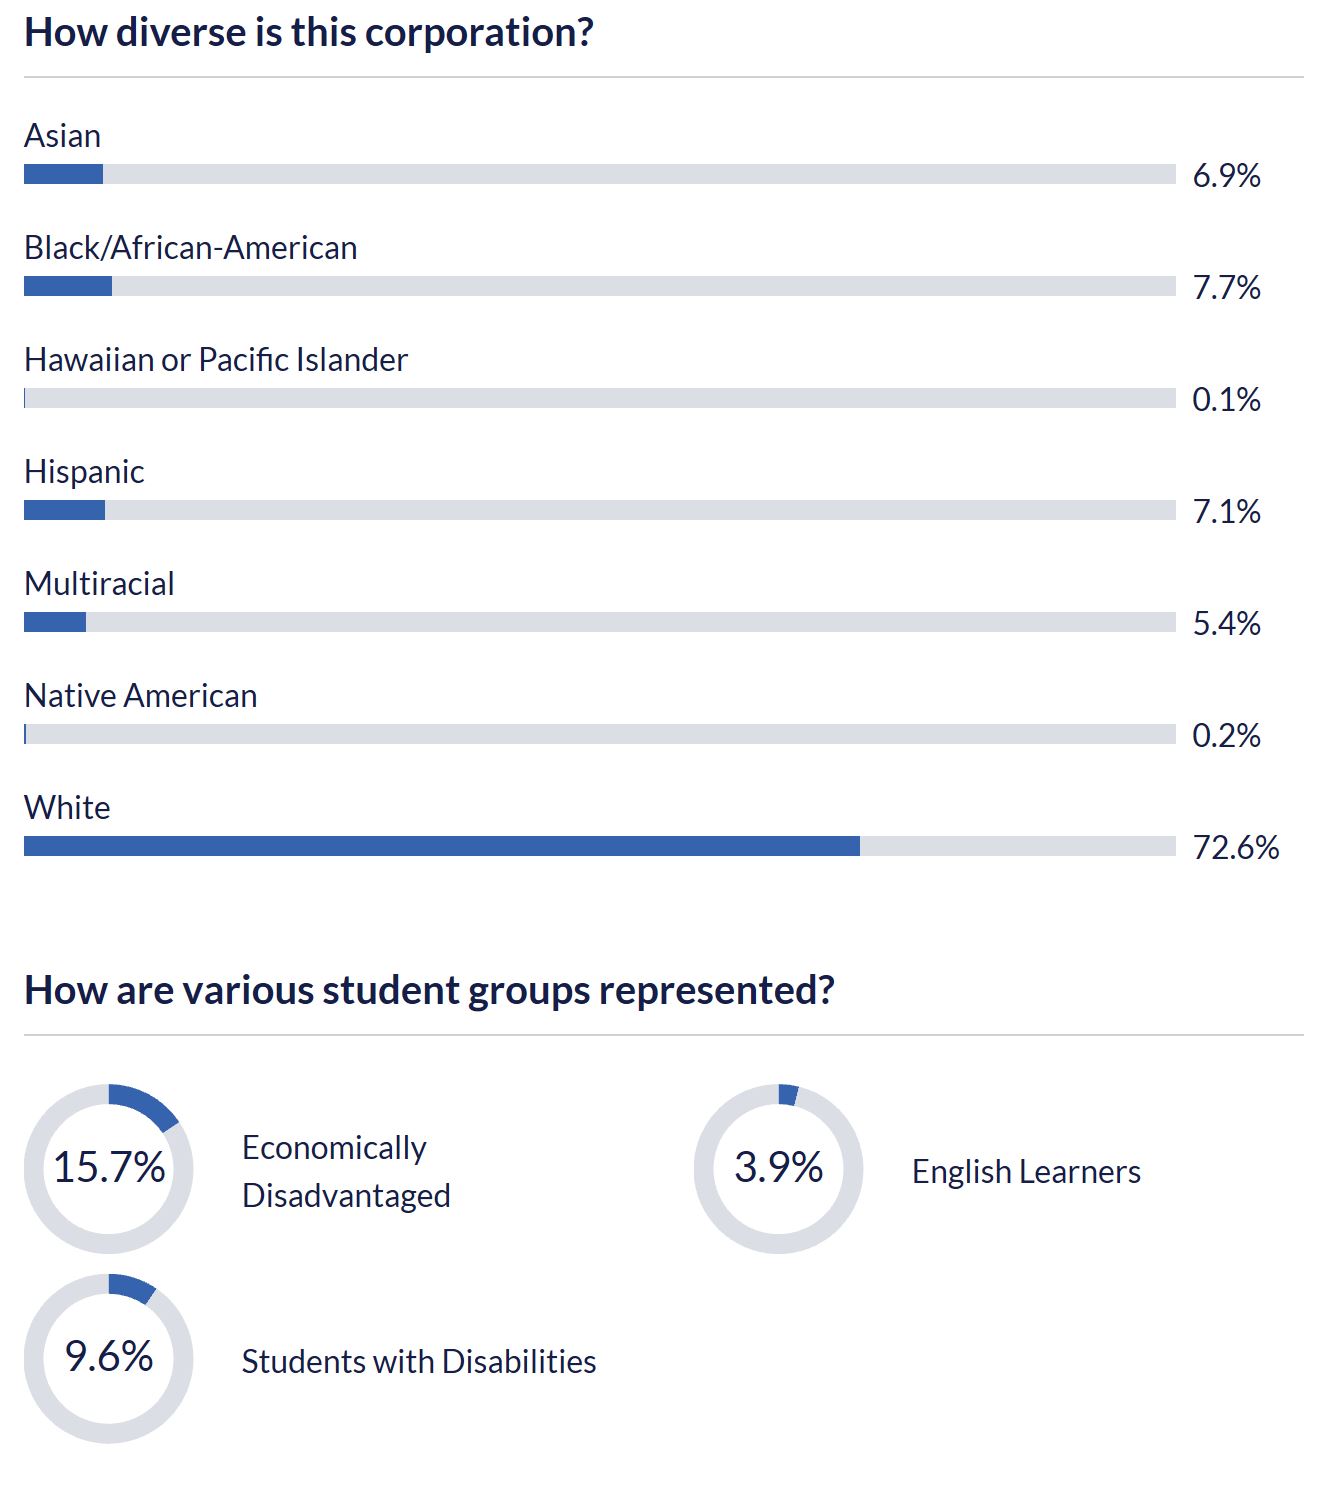
Clearly, HSE Schools are predominately White (72.6%) with most people being economically “stable” (84.3%).
Where then do disciplinary problems occur?
The following chart from the DOE site shows that there were 1,384 safety and disciplinary issues reported in 2017-18 for the HSE School district. This is the most recent data in the DOE system. This is broken out between suspensions and expulsions:
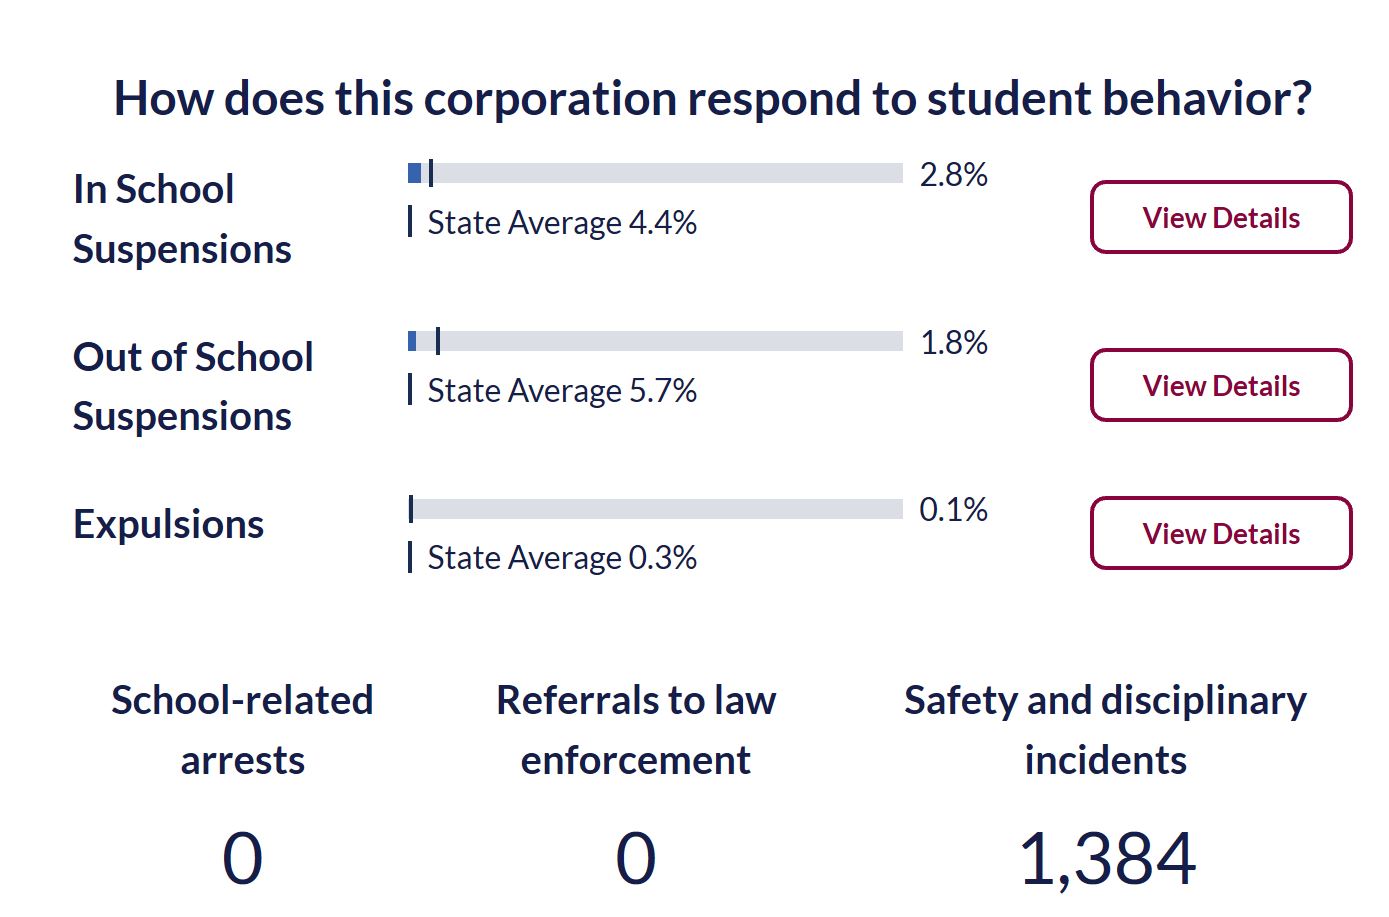
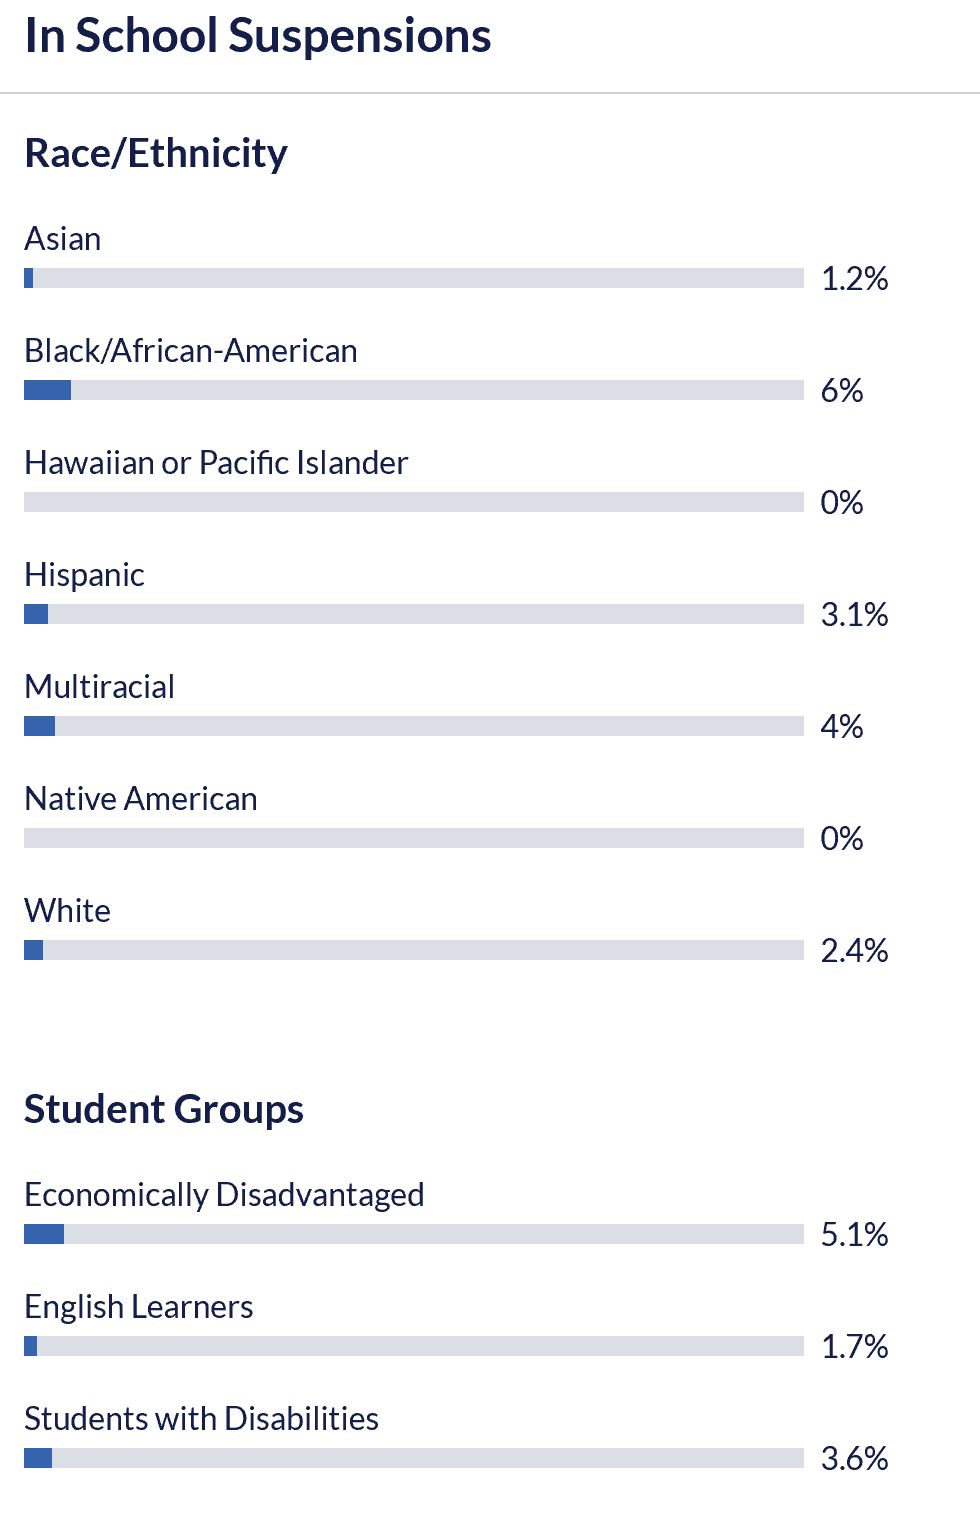
Not surprising, all of the HSE district numbers are lower than the state averages. The biggest area for HSE is for In School Suspensions. If you dig into the In School Suspensions data, you’ll quickly see that while Whites are in the majority of the student body, they are not the majority in the In School Suspensions. Rather, Black/African-American and Multiracial both have more disciplinary issues:
If you look at the Out of School Disciplinary numbers, then not only is it Black/African-American and Multiracial groups that have more disciplinary actions than Whites, but Hispanics also have more cases:
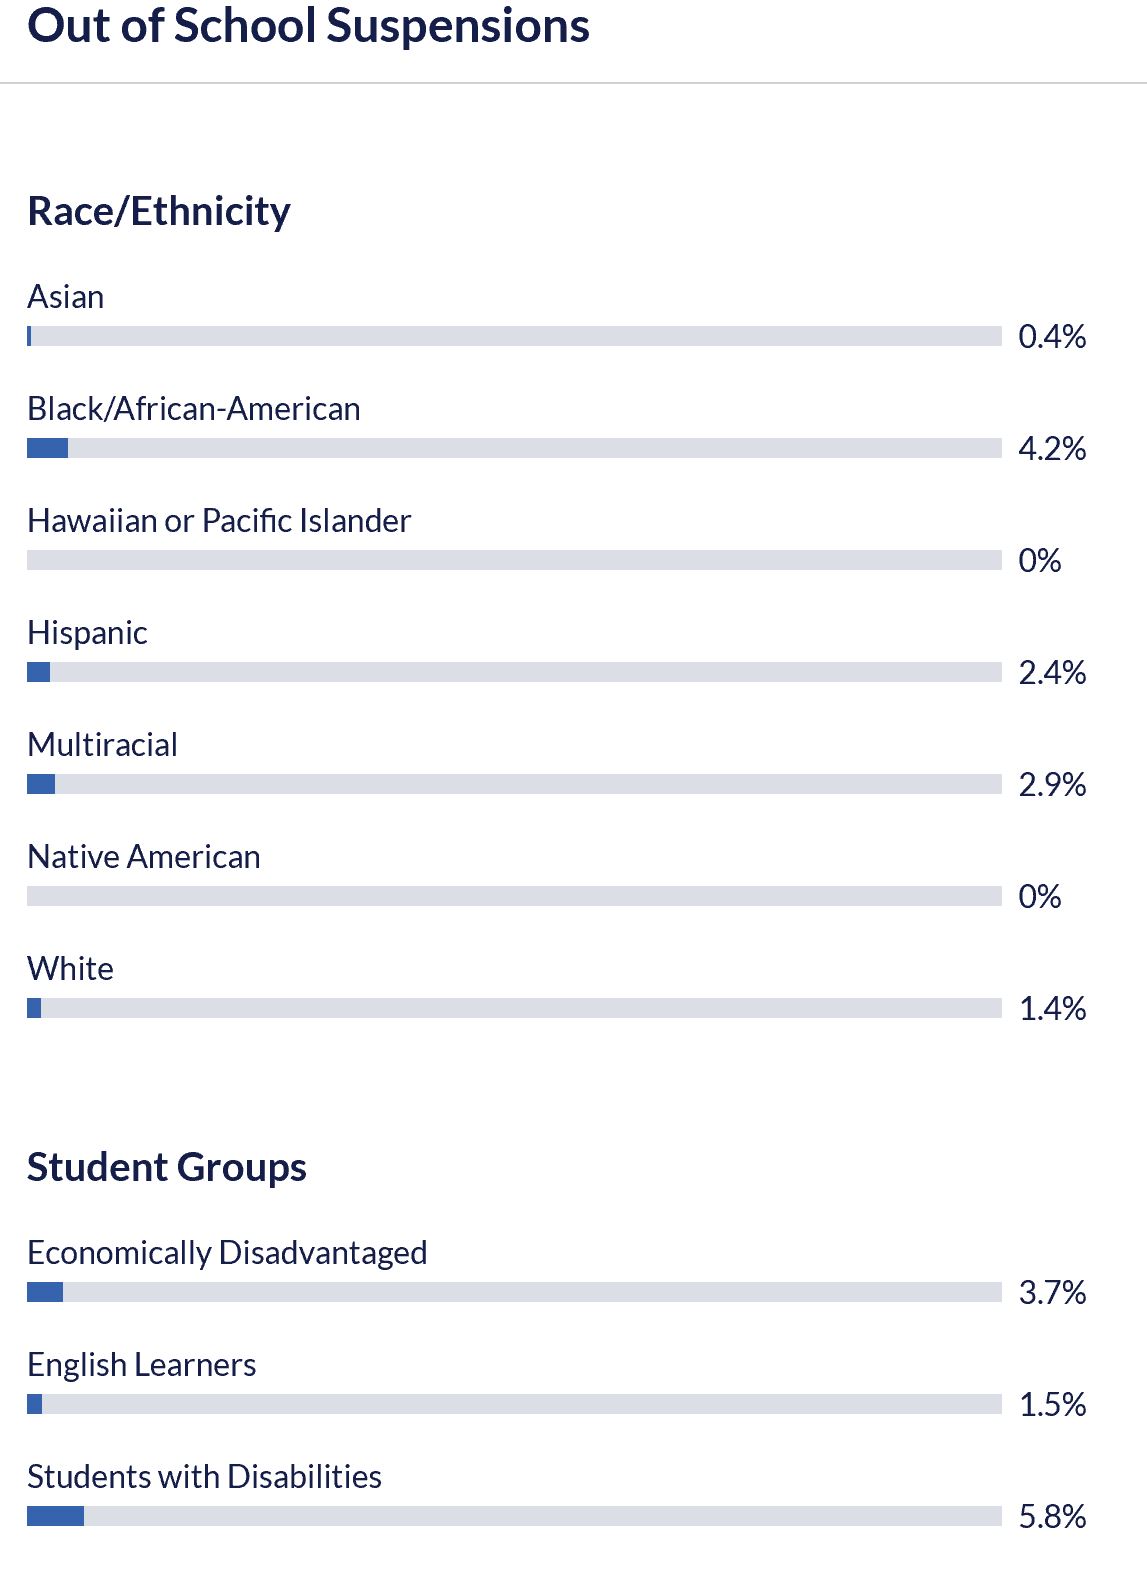
The specific details of these disciplinary actions are not a part of the data I found. While no conclusions can be drawn from this data along, it is easy to infer from the data that a substantially higher percentage of non-White students are likely to face disciplinary action than White students within the district.
The Out of School suspensions within IPS showed the ration of Black/African-American to White as 3 to 1, which is similar to HSE Schools. While this might seem to indicate a consistency, the ration of Black/African-Americans to Whites at IPS is 2 to 1 versus HSE’s 1 to 10. That disparity makes this a topic that should be looked into deeper.
A final note on numbers…
As mentioned, HSE had 1,384 issues reported. While this might seem like a lot, if you look at the entire state of Indiana, the number of issues reported was 223,611. Indianapolis Public Schools (IPS) had nearly 13,000 reported issues (12,891). During the same period, Carmel Clay Schools had only 624 disciplinary incidents, which is less than half of HSE’s number. Having said that, Carmel also had 24 school-related arrests and 6 referrals to law enforcement, whereas HSE had none. It is interesting to note that IPS also had no arrests or referrals to law enforcement during the reporting period.
It is always interesting to look at data and see what stories it tells. To look closer at this data, you an check out the DOE site at:
https://inview.doe.in.gov/corporations/1030050000/profile
# # #