As we pump more dollars into our schools, we expect that the impact will be positive on our kids. With that in mind, along with the next round of ISTEP tests getting ready to happen, I took a quick look at the ISTEP scores over the last few years to see how the increased investments in Hamilton Southeastern Schools are paying off.
For the 2016-17 school year, Hamilton Southeaster Schools had an overall passing grade on the ISTEP of 72.5%. This is the result of 7,169 students passing. That left 2,726 kids that did not pass, or 27.5%. Compared to the scores for the entire state, 51.4%, the pass percentage was great.
Stepping back to the 2015-16 school year, you might expect that the overall passing scores were lower; however, you’d be wrong. The passing score for that year was slightly less at 72.5% or 7,237 students. There were 2,686 students that did not pass.
Although the trend was towards poorer performance, the numbers were very close. As such, you’d hope that we saw an increase from the previous year, 2014-15. Your hopes, however, would again be dashed. In 2014-15, HSE had 7,135 students pass, which was 73.6%, a full percentage point higher. That left 2,556 students that did not pass ISTEP.
When you put the three years together, the trend is not the one you want to see:
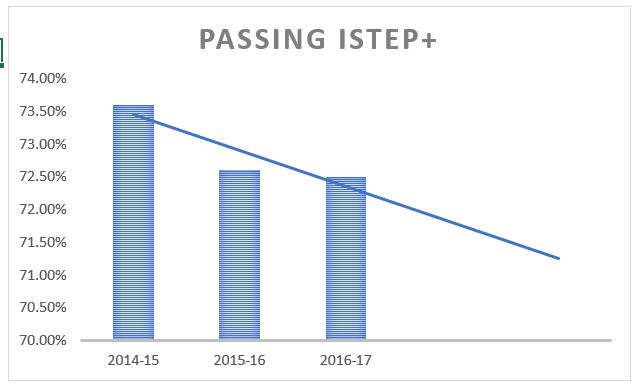
The downward trend is for all the HSE schools combined and for all grades. You can dig into the data on the Department of Education site and see how each of the individual schools performed. For example, Geist Elementary had a passing score of 87.8% in 2014-15, which helped raise the overall HSE score. Unfortunately, they dropped to 85.4% in 2015-6 and then dropped further to 77.5% in 2016-17.
Riverside Junior High was at 75% in 2014-15. They went to 74.1% in 2015-16 and then dropped further to 69.3% in 2016-17. Riverside Intermediate School, on the other hand, bucked the trend. They were at a passing rate of 71.8% in 2014-15. They increased to 74.2% in 2015-16, and then further increased to 75.4% in 2016-17.
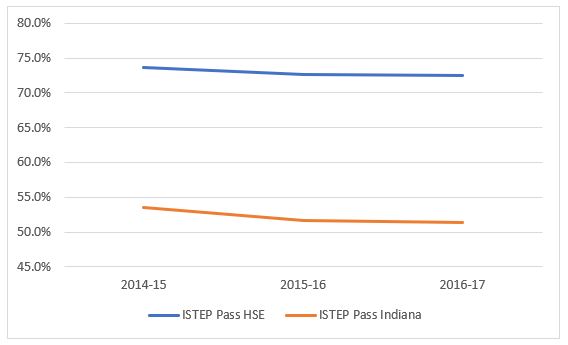
While I’ve painted a bit of doom and gloom on the downward trend, it is worth noting that the scores across the state dropped as well. They went from 53.5% in 2014-15 to 51.6% in 2015-16. In 2016-17 they dropped further to 51.4%. As such, the overall state drop is slightly greater than HSE.
In 2014-15, the ISTEP test was updated. The result was that you can’t compare earlier scores. A new test is also going to replace the ISTEP in the near future. This will also make year-over-year comparisons going forward harder as well. I should disclose that I’m not a fan of the ISTEP test or how it’s the state is using the scores. That, however, is a topic for another post.
# # #