It’s always interesting to stumble upon new data related to our local schools. I was shown data on “school environments.” More specifically, I reviewed data summarizing disciplinary actions with schools and school districts. This data is available on the Indiana Department of Education (DOE) web site. On this site, you can find information on Indiana school districts and achievements, as well as on the data I mention here regarding school environments.
You can visit the site for the details. What drove me to this site was the promise of data on discipline. My understanding is that this is based on data reported to the state by the school districts. What also lead me to this site was a discussion on the disparity of discipline within schools in Indiana.
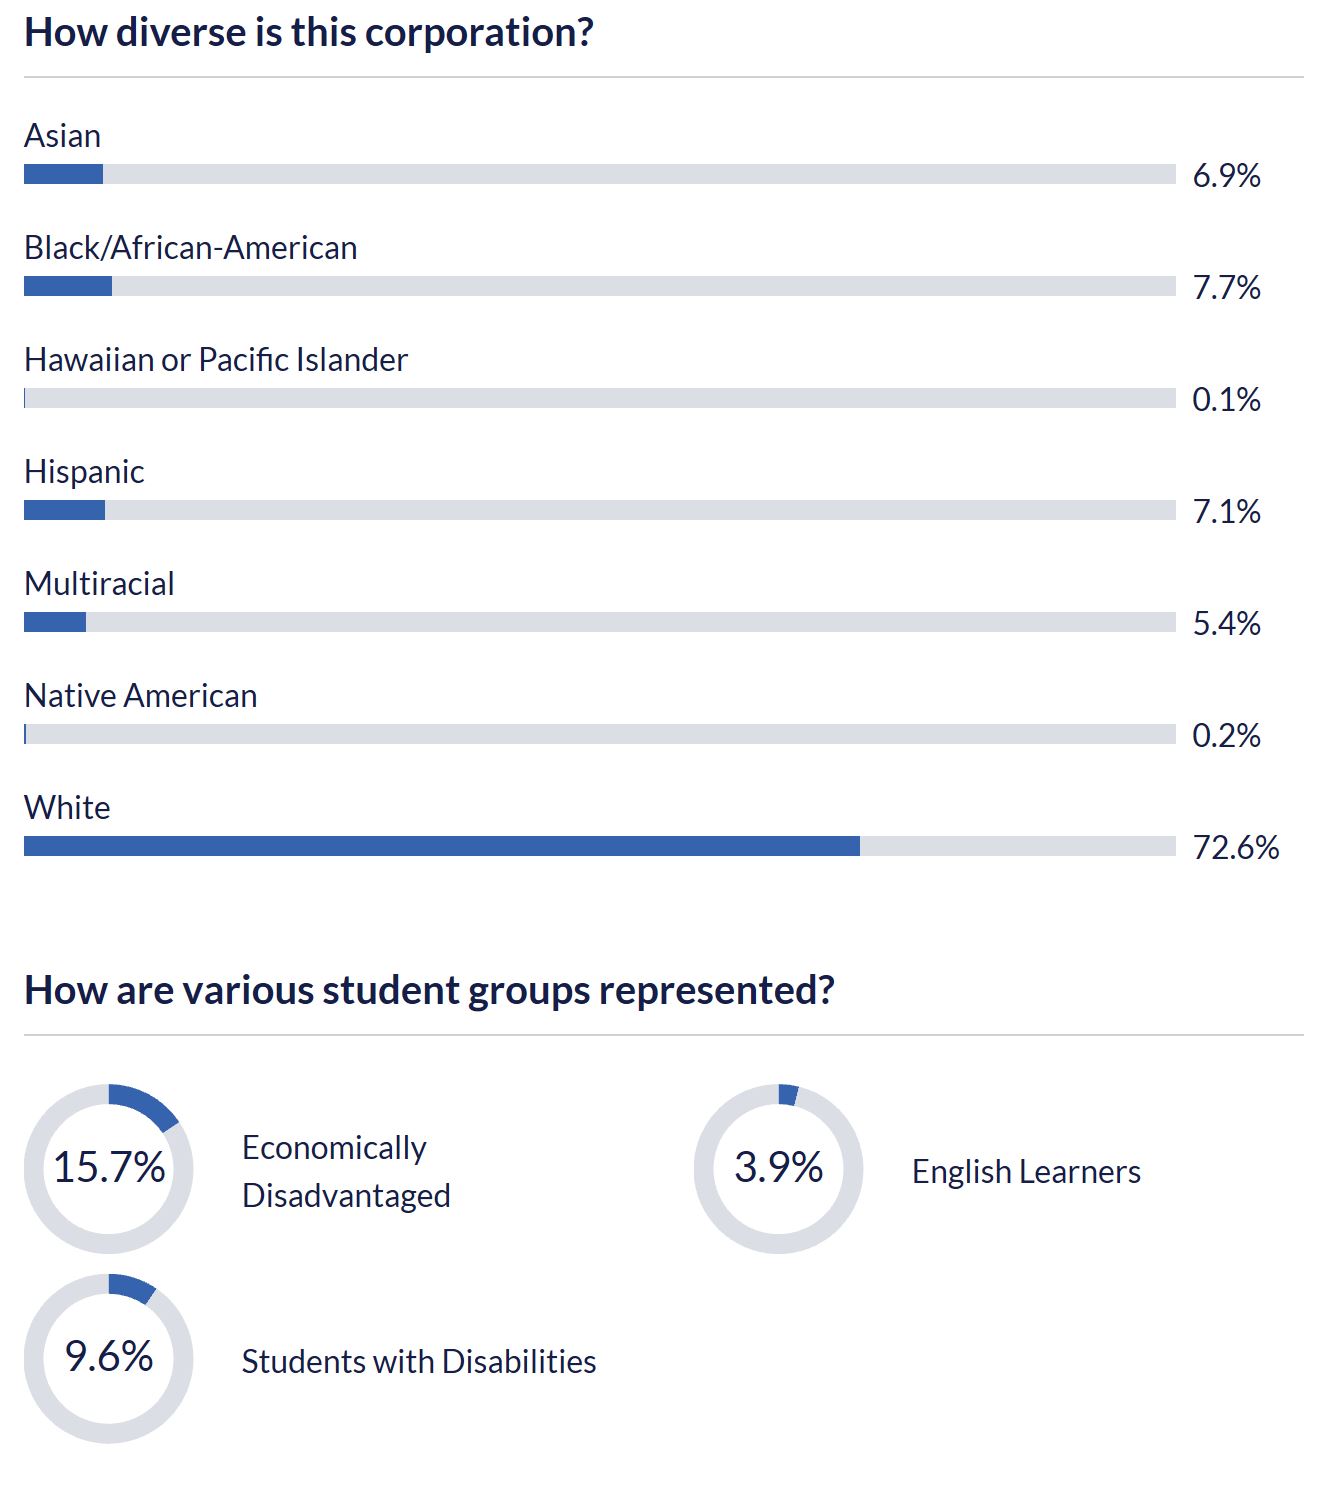
Of course, the starting point to look into this is knowing the diversity of HSE Schools. The DOE site presents the following data:
Clearly, HSE Schools are predominately White (72.6%) with most people being economically “stable” (84.3%).
Where then do disciplinary problems occur?
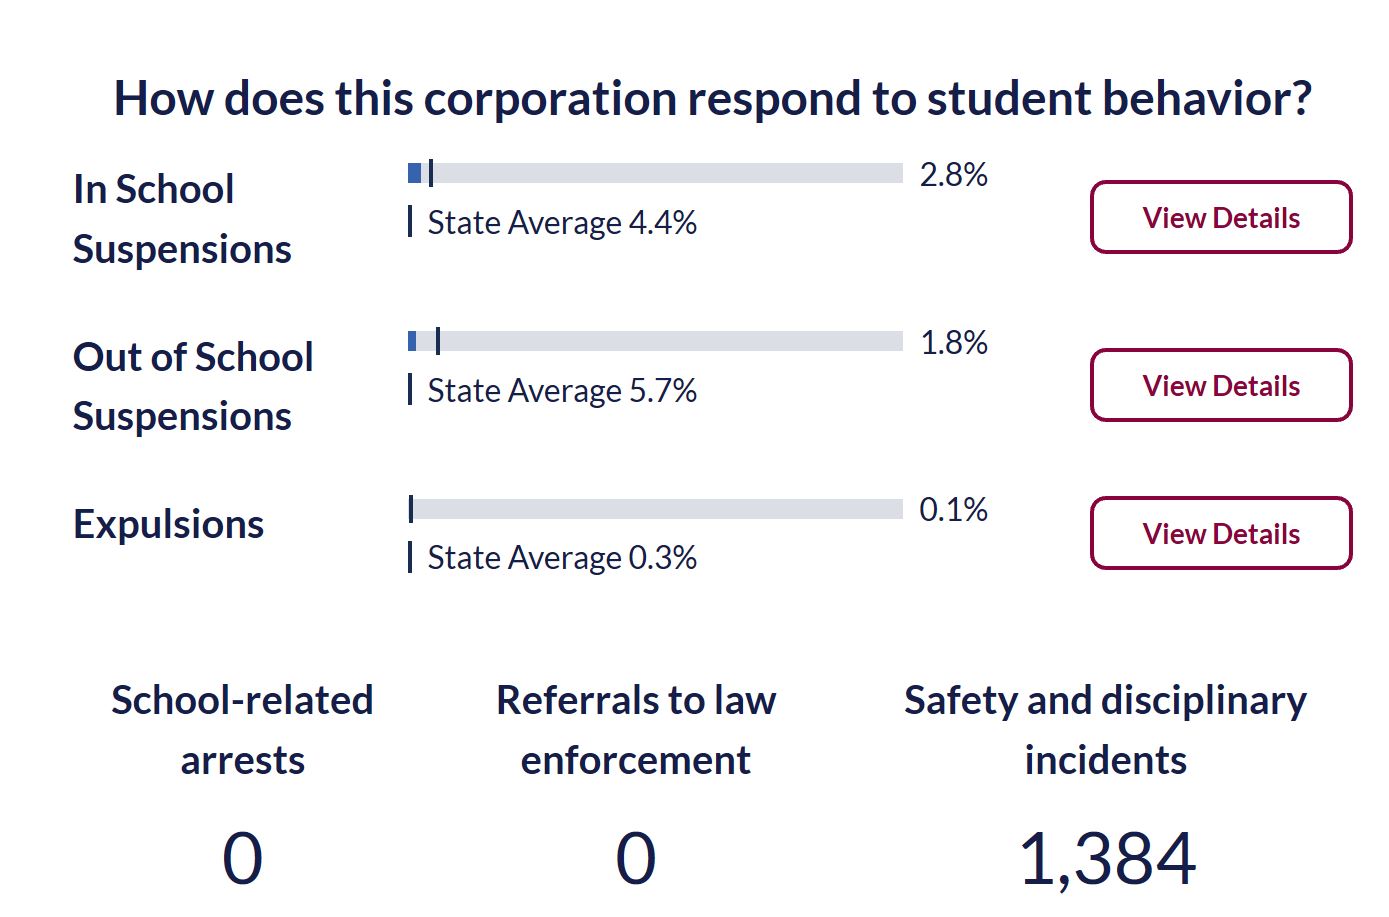
The following chart from the DOE site shows that there were 1,384 safety and disciplinary issues reported in 2017-18 for the HSE School district. This is the most recent data in the DOE system. This is broken out between suspensions and expulsions:
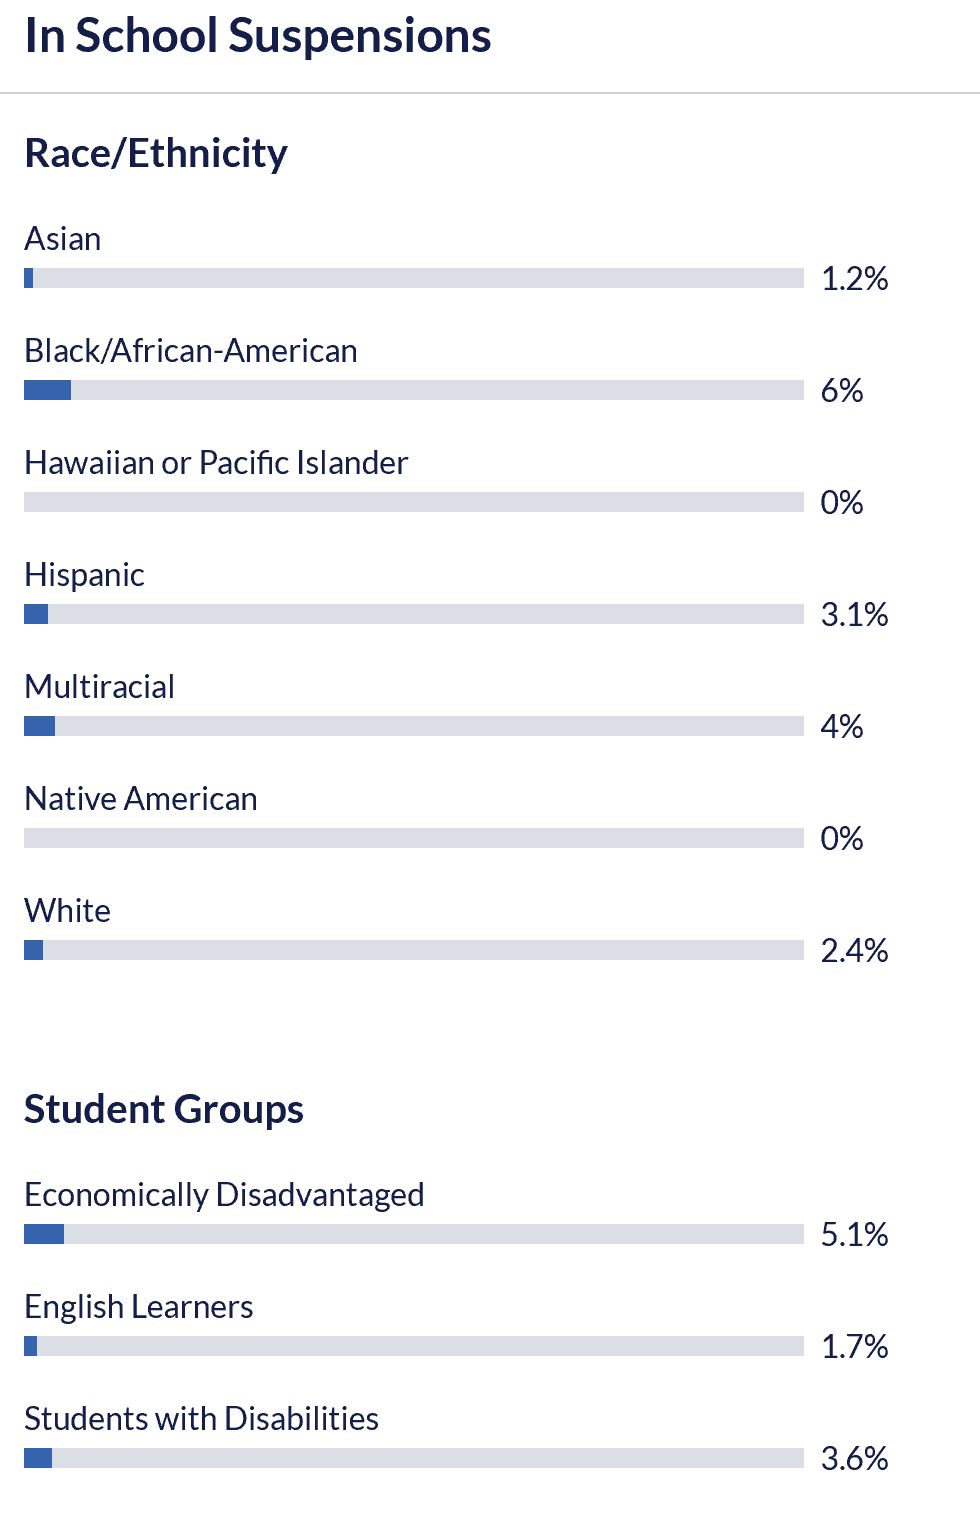
Not surprising, all of the HSE district numbers are lower than the state averages. The biggest area for HSE is for In School Suspensions. If you dig into the In School Suspensions data, you’ll quickly see that while Whites are in the majority of the student body, they are not the majority in the In School Suspensions. Rather, Black/African-American and Multiracial both have more disciplinary issues:
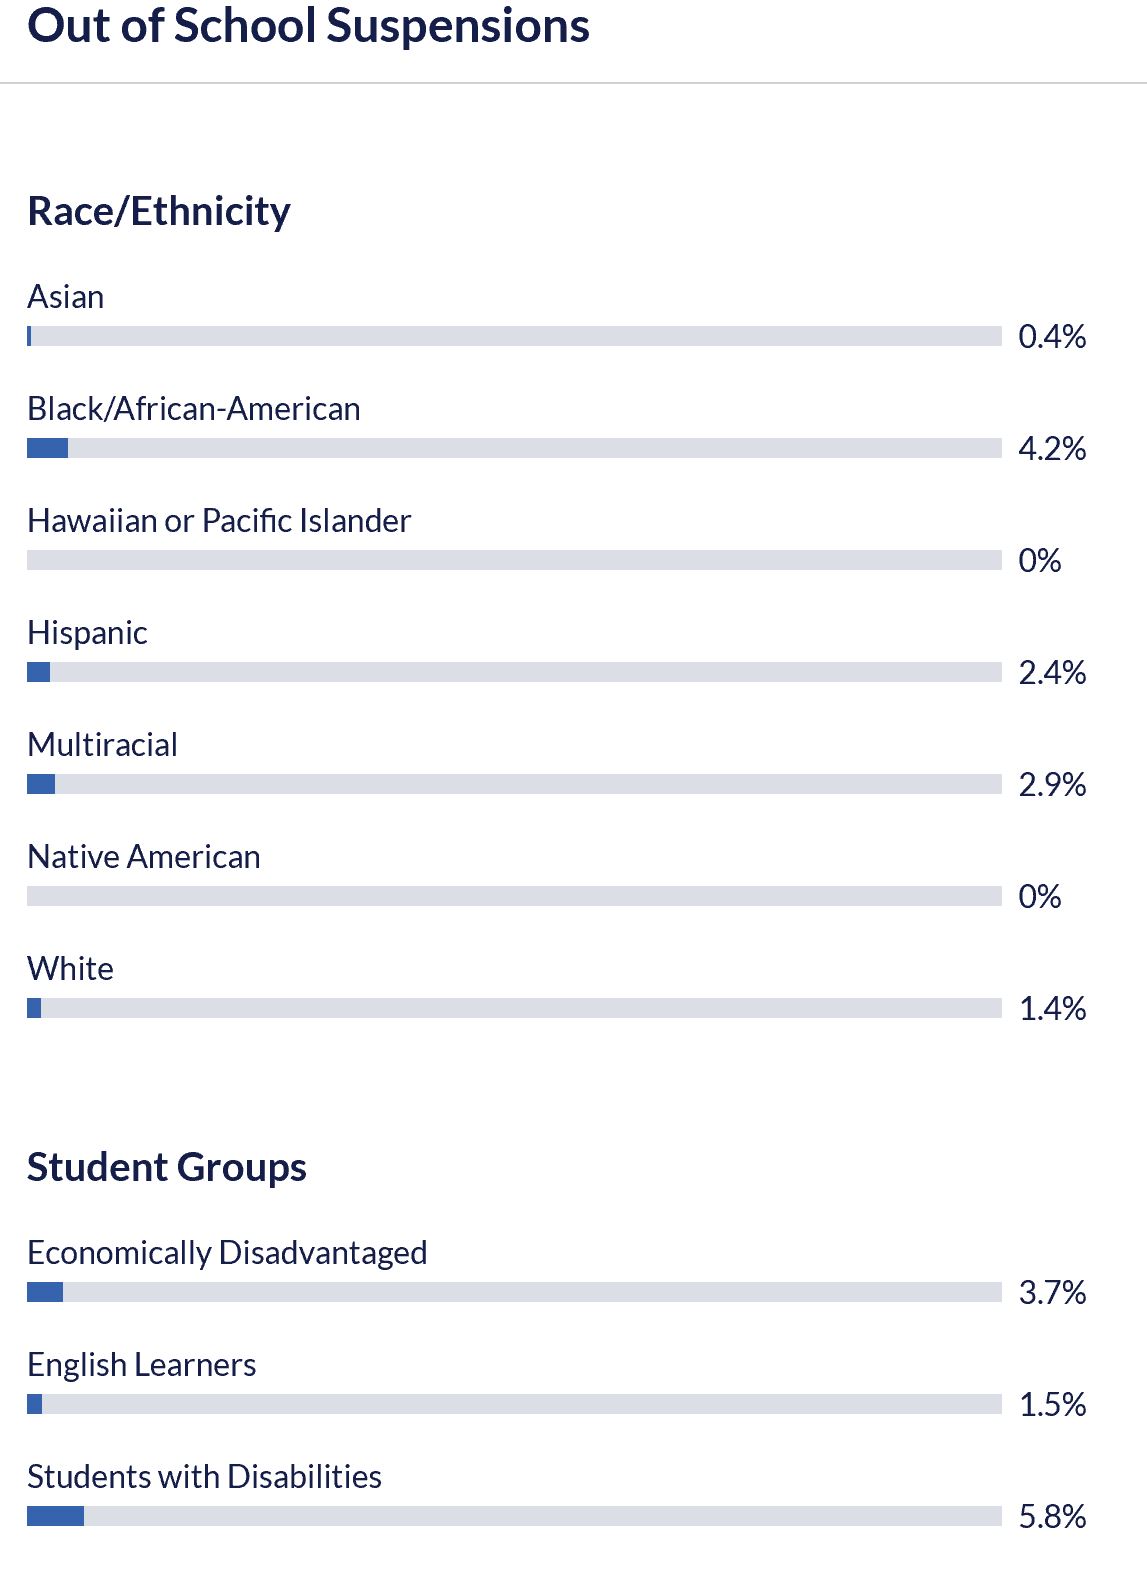
If you look at the Out of School Disciplinary numbers, then not only is it Black/African-American and Multiracial groups that have more disciplinary actions than Whites, but Hispanics also have more cases:
The specific details of these disciplinary actions are not a part of the data I found. While no conclusions can be drawn from this data along, it is easy to infer from the data that a substantially higher percentage of non-White students are likely to face disciplinary action than White students within the district.
The Out of School suspensions within IPS showed the ration of Black/African-American to White as 3 to 1, which is similar to HSE Schools. While this might seem to indicate a consistency, the ration of Black/African-Americans to Whites at IPS is 2 to 1 versus HSE’s 1 to 10. That disparity makes this a topic that should be looked into deeper.
A final note on numbers…
As mentioned, HSE had 1,384 issues reported. While this might seem like a lot, if you look at the entire state of Indiana, the number of issues reported was 223,611. Indianapolis Public Schools (IPS) had nearly 13,000 reported issues (12,891). During the same period, Carmel Clay Schools had only 624 disciplinary incidents, which is less than half of HSE’s number. Having said that, Carmel also had 24 school-related arrests and 6 referrals to law enforcement, whereas HSE had none. It is interesting to note that IPS also had no arrests or referrals to law enforcement during the reporting period.
For those that don’t know, within the Hamilton Southeastern
Schools (HSE), the superintendent is Dr. Bourff. On a regular basis, Dr. Bourff
meets with a group of people from across the district. This group is primarily
composed of leaders from each of the school PTOs as well as a handful of
additional parents provided by school board members.
Today, Dr. Bourff met with this group and provided some discussion
on a number of things happening in the district. This posting is a summation of
my notes from this meeting.
New Administrator
Dr. Bourff introduced Kim Lippe as the Executive Director of
Student and Staff Services. Kim’s role replaces the position that was vacated
by Mike Beresford and was being temporarily filled by Dr. Carnes. Per the HSE
web site, she will be responsible for a variety of things:
Oversees Human Resource and Student Services
Departments
Primary Director Overseeing Certified Staff
District Liaison to the Teacher’s Association
Regarding Contract and other Personnel Issues.
Coordinates Hiring of Administrative and
Certified Instructional Staff
District Supervisor of Matters Involving Student
Behavior, Attendance, Discipline, and Due Process
District Supervisor of School Safety
Homeless Liaison for the District
District Supervisor of School Counseling Program
District Supervisor of Student Services
Corporation Liaison to School Attorney and other
Legal Services
Social Emotional Learning (SEL)
If you are not familiar with the acronym SEL and the term Social Emotional
Learning, you might want to research it a little bit if you have a student
within HSE. This acronym is being used more and more.
The district has set up a web page on the district site at https://www.hseschools.org/counseling/social-emotional.
This page has information on SEL including an embedded whitepaper with tons of
information including an overview, stats, HSE milestones, and much more. I
won’t rehash the material here, as you can find it all at the link included.
One of the ways SEL is happening within the district is
through the #WeGotThis program. A video had been sent to all parents
earlier this year promoting the We Got This concept. I’ve included that video here:
What was shared in Dr. Bourff’s committee meeting were a few
points related to SEL. First, meta studies have shown that there is a 11%
increase in academic success in schools that have SEL programs. He also
clarified that the mental health initiative within the district is different
from SEL. Whereas mental health is considered a health-based concept, SEL is
considered to a set of skills. Many of these skills are aimed at understanding
and managing emotions, stress, and more.
It was shared that most employers consider SEL skills to be
the hardest to find, ye the most importance for success. As such, the more the
district can do to teach SEL skills, the better candidates our kids will be for
future jobs.
The district plans to continue working to identify stressors
in our schools and other elements that can be addressed to improve SEL. In
addition to the #WeGotThis video that was distributed and the second video on
the HSE site, there are currently plans to produce roughly seven more videos.
The district is open to ideas for topics for these videos. An example of one topic
that has come up is vaping.
In addition to the videos, the administration has been
sending monthly tips to the staff and are looking to possibly do more around
parent-teacher nights and other events.
iLearn
ilearn, like iStep, is almost considered a dirty word, but
the more I hear about it, the less I feel that way. Dr. Combs present results
from the iLearn tests at this meeting. They also presented the same information
to the board earlier in the morning. Having attended both presentations, the
information was the same; however, the advisory meeting in the afternoon
produced many more questions.
One of the key things mentioned was about how iLearn is
different from iStep. This is an important distinction. In short, the iLearn
has been created to be much more application focused. Rather than being pure
regurgitation of facts and figures, it tests in a more authentic learning
style. Simply put, it tests to see if a student can apply what they learned
versus simply testing to see what they learned.
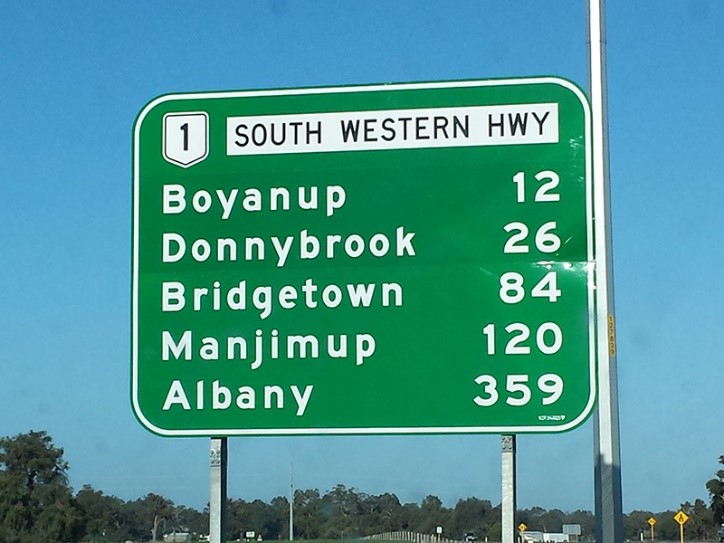
In an application-based learning style you are asked to
solve what are more real-life scenario questions. For example, a math question
might ask, what is the distance between Bridgetown and Albany based on the
following sign:
This test is a simple subtraction problem. This would be a math
problem where the student would need to take the 359 and subtract the 84 miles
from Bridgetown. On the iStep test, this would have been a question asking the
student what 359 – 84 is. While these both are asking the same question, the
app-based requires the student to be able to not only know the answer to a math
problem, but to be able to apply it in a more authentic manner of learning. In
short, the iLearn doesn’t just test that the student memorized something, but
rather tests to see if they can apply what they learned.
In addition to talking about the testing approach, data was
shown for the results. This included showing many charts and graphs as to how
the students faired.
With a new test, the expectation is that scores will go
down. Dr. Combs stated that scores go down every time there is a new test, but then
slowly pick up. Dr. Combs also commented on the number of kids that failed. HSE
Schools performed above the state average in both the math and languages areas
of the tests. Even so, there was a dip in the number of kids that passed. The
standardize tests are create with an expectation that a certain number of kids
will fail. There is an expected “cut rate”
One of the other changes with the iLearn is that the test is
more adaptive or responsive. As a child takes the test, if they get an answer
correct, then they will be given a harder question. If they get an answer
wrong, the next question given should be easier. In addition to this responsive
nature, the testis was also changed to remove the time element. Kids are given
the they need to complete the test.
It was also noted that the tenth-grade class did not switch
to iLearn this past year, but still used iStep. Their scores were also
presented. This year the tenth-grade testing is expected to be skipped, but the
current class will take the test in their Junior year. This will be a “yet to
be named” test, but could be a version of the S.A.T. or another test.
Other Testing
Dr. Bourff mentioned that the state is looking into other
measurements beyond just the iLearn test that can be used to assess kid. This
includes looking into different measurements from traditional test scores. This
is one of the reasons the district used Panorama.
The Panorama testing has been discussed at school board meeting in association to administrative goals. I wrote an article recently on ‘Striving for average’ that is related to this testing. You can find the results of the Panorama survey on the HSE site on the analytics page at https://www.hseschools.org/about/analytics. There are both the Family-School Relationships Survey results and the Panorama Student Survey Report.
Flipped Schedules
Flipped schedules and the potential of HSE Schools flipping
the start time has been a topic at school board meetings and on social media
for a while now. Dr. Bourff mentioned that the administration is research this
and is planning to have a recommendation for the HSE School Board by the end of
the calendar year. If the recommendation requires action, then it is hoped the
board will make a decision in January of 2020 for action possibly next fall for
the 2020-21 school year.
Dr. Bourff mentioned that there is a lot of reasons for
flipping as well as counter arguments. One of the big reasons for flipping
would be the mental well-being of kids. Specifically, younger kids learn better
earlier in the day and tend to be finished (wiped) by 2:00 or 2:30. Our younger
kids currently go well past this time. It is thought that older kids do better
later in the day than the younger kids.
It was note that Noblesville has flipped their start times
as have other schools. Dr. Bourff is talking with the other districts. He has
also talked with students at the high schools and plans to have additional
discussions with not only kids, but also other groups.
The discussions regarding flipping include looking at a few
other things as well. HSE has some of the longest school days with our older
kids going roughly 50 minutes more than the required daily minimum. It was
stated that because HSE has high performing schools, there is an expectation of
longer class days. The elementary kids go roughly 75 minutes more than the
required daily minimum. Some changes at the state level have opened a window to
where these times could possibly be reduced a little bit. In the past, I’ve
heard mention of possibly cutting 20 minutes from the elementary schools;
however, that is not yet determined. Dr. Bourff was asked about the 20 minutes
in the meeting.
In addition to possible time adjustments, there is also
consideration of changing the transportation model. It was noted that there are
not enough busses or drivers to do all the schools at the same time, so there
will still need to be staggered start times in the district.
One question raised asked about the impact of start times on
testing results. Dr. Bourff commented that history has shown that the change in
start times has very little impact on testing results. The change in start
times, therefore, focus more at improving the kids’ mental well-being.
In the advisory meeting, feedback was given that echoes what
has been seen online and in other locations regarding flipping start times.
This includes the issues of childcare and the impact on sports. A key point of
feedback point given to Dr. Bourff was in regard to his gathering to feedback
from a variety of sources on this topic. If the administration is going to push
for a decision based on data that says flipping is best for the well-being of
the kids, then he might want to forego getting feedback. The reasoning being,
if all the feedback says, “don’t do it,” then it will look really bad to do the
switch anyway. Dr. Bourff indicated that
he wants to collect the feedback, and that the decision will not be solely
based on the data but will consider those all of those that are impacted as
well.
In Conclusion
This is a summary, (my summary and a long one), of the core topics covered. Last year I was president of the Riverside Junior High PTO and shared this at the PTO meetings. Being that PTO leaders are a part of this meeting, you should ask them to share their perspective on the Superintendent Advisory Council meetings at your upcoming PTO meetings. These happen quarterly, so they won’t have an update every time!
While I have your attention, check out my latest book, which is available on Amazon.com. It’s a fun, “find the difference in the pictures” book where you also learn a tidbit about the public parks in Fishers:
The other day I listened to a school safety webinar. A lot of familiar information was covered, but one tidbit of information stood out, which I’m sharing here.
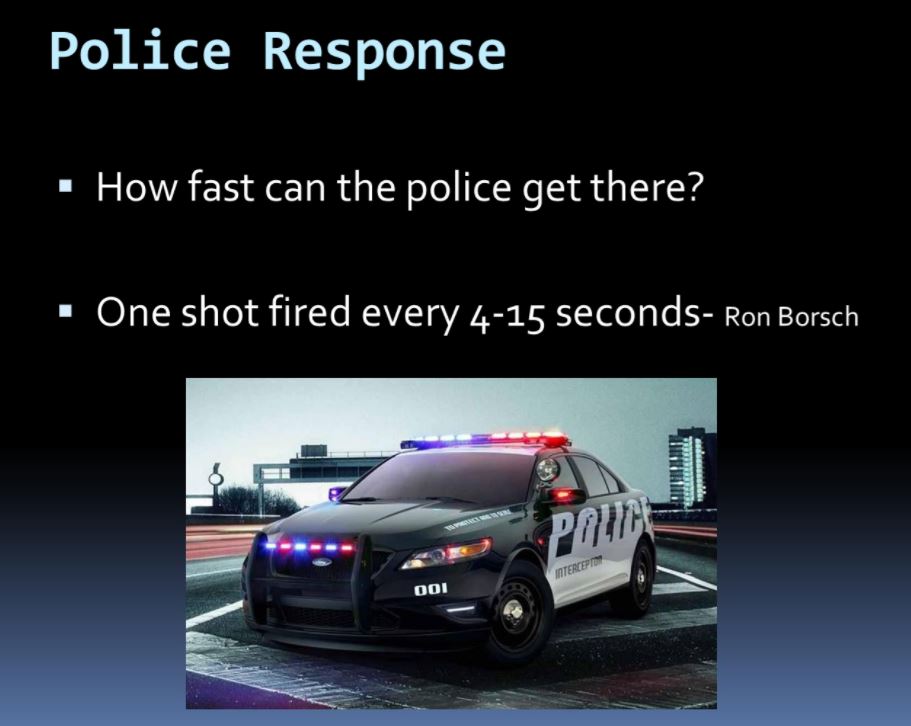
If you don’t follow my blog or School/Kids focused Facebook page, then let me state that SRO stands for School Resource Officers (SROs). While the webinar was ultimately trying to sell software to help with school safety, my takeaway was further confirmation that the use of SROs within schools is important. While there are many reasons for this (look at some of my old articles), the webinar pointed out one big reason which is summarized in the following picture:
If there is an incident at a school, such as a school shooting, then how fast can a police officer get to the school? When you weigh this against the data point that with a standard weapon, one shot can be fired every 4 to 15 seconds, you quickly realize that minutes matter – a single minute matters.
It was stated that it can take 4 to 9 minutes to make a call for help. In that time, you could have over 15 casualties. If an officer can respond in 3 minutes, then that could be an additional 12 casualties. If the officer that shows up is a marathon runner, then they might be able to get from their car and into the building in a single minute. That minute could be another 4. That puts the total at over 30 with the assumption of a shot every 15 seconds rather than 4 seconds.
In the webinar, it was indicated that the response time of police to aggravated assault ranges are generally five minutes or more. Only 21 percent of responses by police happen within 5 minutes. 33 percent are within 6 to 10 minutes and 36 percent are from 11 to 60 minutes. Roughly 10 percent are of an unknown length of time. At a five minute response time, that’s between 20 and 75 shots with standard weapons.
Having SROs in place would eliminate the response time from the equation as well as the need to do an initial all, which are the longest delays in the equation. That means lives potentially saved. That seems like one big reason to have them.
Of course, this value is only seen when there is security breach at a school. The impact on SROs goes way beyond just being available for emergencies, but that’s a different article!
At the August 28th, 2019 Hamilton Southeastern Schools board meeting, there was one topic that surprised me in that it didn’t get more attention by the school board. What surprised me even more was the willingness to set goals that strive to be average in a district that is rated as high performance and one of the best.
The school board presented three goal areas for the administration and district. The three areas that were presented are: The goals that were presented are:
1A. The language arts academic achievement gap between the highest performing student group and the lowest performing student group will be reduced by 6% in this academic year without compromising the achievement gains of the highest performing group.
1B. The math academic achievement gap between the highest performing student group and the lowest performing student group will be reduced by 8% in this academic year without compromising the achievement gains of the highest performing group.
2A. The sense of belonging for HSE students in grades 3-12 will increase to a level consistent with districts of similar demographics.
2B. Teachers’ perceptions of the overall school climate will increase to a level consistent with schools districts of similar demographics.
3. HSE Schools will maximize the use of its current and potential facilities in order to provide excellent learning environments for all HSE students.
The wording of the last goal was reviewed and adjustments are being made to it. The other bullets, however, were close to what is likely to be final.
The first two bullets are about reducing the achievement gap. This is a good goal, although you would hope that they would also work to improve on the highest performing group and not just the lowest group. The achievement numbers for 1A and 1B are based on the iLearn scores. The 6% was based on what it was believed would be needed to make the gap more in line with other schools after 3 years of similar improvements.
It is bullets 2A and 2B, however, where concerns should be raised. It was stated that HSE school district is compared to other schools of similar size. In doing this, it was stated by Dr. Combs that HSE ranks around 30% and 40%. The goal is to get this to 50%. Said differently, HSE students are currently indicating that they feel they belong less than most schools – we are ranked below average. Similarly, our teachers perception of the overall climate is worse than a majority of the schools of similar size. The goal is set to get this to 50% or average. More schools below and above.
We are shooting to be average. Why wouldn’t we be shooting to be better than average. Even 51% would mean more of our students feel like they belong than the average school and more of our teachers have a good perception of our district’s climate than teachers at other schools have about their districts.
To mean it seems it seems like we currently have a grade of a D and F and are striving for a C. In a high performance school district, I would hope we could work to try to be at the top for giving our kids a sense of belonging as well as building a climate where all of our teachers feel a sense of belonging.
As the board revisits these goals, I hope they don’t accept average as acceptable. In fact, I hope they start asking questions as to why we are scoring below average now.
As the board revisits these goals, I hope they don’t accept average as acceptable. In fact, I hope they start asking questions as to why we are scoring below average now.
UPDATE: Changes were made to the goals so that it is no longer targeting average, but rather “average or better”.
As part of the Stigma Free Fishers initiative, data is now
being collected so as to better understand what is happening in our community.
Per the report, prior to 2016 there was not access to clean data that could be
used in regard to behavioral health incidents. Since the start of the
initiative in 2016, the Fishers Fire and Emergency Services Department and the Fishers
Police Department have worked to ensure accurate data. In addition to the
public service organizations, Hamilton Southeastern Schools have also been a
part of the initiative as have businesses and other organizations.
The City of Fishers along with a number of organizations has
taken on a mental health initiative. Back in May, they released a community
report on the initiative.
From the data collected, it has been seen that there has been
a decrease in disciplinary action in the schools as well as a decrease in the
number of missed school days. Additionally, there has been an increase in the
average GPA within the district.
Suicide is the 11th leading cause of death in the
State of Indiana. The first year of tracking in 2016 saw 11 suicides in the area
(Fishers). This increased to 14 in 2017, before decreasing to 10 in 2018. With more
than 9 million people pondering the idea of suicide, it is core focus for
mental health well-being.
Unfortunately, while 2017 saw a huge decrease in the need
for immediate detentions dropping to 138 from 191 in 2016, in 2018 this went
back up to 197.
Several initiatives have been happening to try to reduce the
numbers even further. These initiatives include promoting the #StigmaFreeFishers
through social media and other locations. An evidence-based suicide prevention
lesson has been taught to over 1,757 eighth-grade students. Four student clubs
have been created, which include the Bring Change to Mind at Fishers High
School and Hamilton Southeastern High School. The Calm Squad was created at
Fall Creek Elementary. These are in addition to other groups that already
existed with a focus on acceptance and related topics. The schools are also
providing mental health services when need, which have been used by nearly 100
students.
The following video summarizes a lot of the data and results
from the initiative. This includes the HSE School results:
To stay informed on the Fishers Mental Health Initiatives, you can sign up on the Stigma Free Fishers site.